
Summary:Based on MSP430F1611 microcontroller, using digital spectrum analysis and analog band-pass filter bank combination of methods to develop a new two-wire digital steam flow meter to extend the range ratio, to ensure the accuracy of on-site measurement, and to achieve low-power work, to solve There are key technical problems with such flowmeters. Low-power op amps and digital potentiometers are used to form programmable amplifiers to adapt to changes in the output signal intensity of the steam sensor; a bandpass filter bank is selected based on the calculation results of fewer point FFTs, which not only satisfies the variation of the frequency range of the steam sensor signal. The need for optimal filtering of the steam signal; design of an effective power management module and current output circuit to provide sufficient current for the instrument's two-wire operation.
0 Introduction The steam flow meter has the advantages of wide measurement medium, no moving parts, low pressure loss, proportional output signal frequency and state volumetric flow, etc. It has been widely used. However, the on-site measurement accuracy of the steam flow meter needs to be improved, and the turndown ratio needs to be expanded. To this end, related companies and scholars at home and abroad have applied digital signal processing methods to the processing of steam signals to effectively guarantee field measurement accuracy and extended range ratio. Because the above algorithms are more complex and require a large number of calculations, and the instrument has the requirement of real-time performance, a DSP (digital signal processor) must be used to complete the task. However, the power consumption of the DSP chip is large, and the general operating current is more than 100 mA, which cannot meet the requirement of the 4-wire 20 mA instrument. This two-wire, low-power meter is required by many process industries. DSP-based signal processing systems cannot meet these requirements. Although some domestic scholars use low-power microcontrollers to develop low-power, two-wire steam flowmeters, such as: [4] developed a two-wire steam flowmeter using PIC microcontrollers, [5] designed low with MSP430 microcontroller Power consumption steam meters, however, they still use the conventional signal processing mode, ie, amplification, shaping and counting, so it is not possible to effectively extract steam signals from noise. If a low-power microcontroller is used to implement a digital signal processing algorithm, low-power and two-wire systems cannot be implemented. Because a single-chip microcomputer implements a digital signal processing algorithm, the microcontroller must always operate at full speed, and any low-power operation mode cannot be used. For example, the literature [6] uses wavelet transform to eliminate the noise in the signal and uses the MSP430 microcontroller to implement the system. However, the test results show that it is impossible to achieve low power consumption and two-wire system because the operating current of the instrument itself exceeds 4mA. Some well-known foreign companies have designed special integrated circuits (ASICs) for some signal processing modules of steam flow meters and use the hardware method to process steam signals in order to achieve low power consumption and real-time work.
Take the low-power microcontroller MSP430F1611 do a few point FFTr combined with the hardware analog filter bank signal processing methods to achieve the steam signal processing, and then design an effective current management and current output module that can extract steam signals from the noise to ensure Field measurement accuracy, extended range ratio, but also to achieve low power and two-wire work.
1 hardware design
1.1 The goal of the overall scheme design is to use both digital signal processing methods and to ensure that the instrument is working at low power. Therefore, a low-power microcontroller is used to perform fast Fourier transform (FFT) on fewer points to implement periodic spectrum analysis to determine the steam signal. Frequency value; design a set of hardware band-pass filters whose passband covers the frequency band where the steam signal is located, select a specific band-pass filter based on the spectral analysis results, perform optimal filtering, and maximize the elimination of various harmonics and on-site The effect of noise on the measurement increases the accuracy of the measurement. A programmable amplifier is composed of a digital potentiometer and an operational amplifier. The amplitude of the steam signal is determined by peak detection, and the amplification factor of the programmable amplifier is adjusted so that the amplitude of the signal reaches the optimum range and the large flow rate and small flow rate measurement requirements are met. Range ratio. Select low-power microcontroller chip, and designed with its output circuit and power management circuit to ensure that the instrument operating current is less than 4mA, the output current is 4 ~ 20mA, two-wire system work.
1.2 Hardware Block Diagram The hardware block diagram of this system is shown in Figure 1. It includes piezoelectric sensors, differential charge amplifiers, voltage amplifiers, programmable amplifiers, low-pass filters, voltage followers, band-pass filter banks, and bandpass selection switch circuits. Peak detection circuit, shaping circuit, SCM, human interface circuit, 4-20mA output and power management circuit, constant current source, temperature sensor, pressure sensor, differential amplifier, 16-bit ADC. 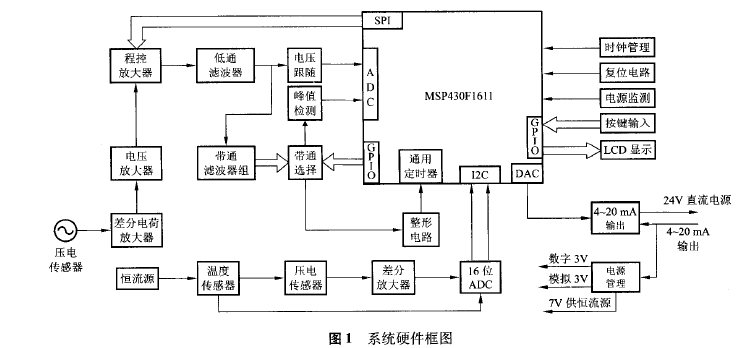
1.3 Work process Piezoelectric sensor output charge signal through the differential charge amplifier into a voltage signal, because the amplitude is very small, so after a fixed voltage amplifier and a programmable amplifier. The amplified signal passes through a low-pass filter, which filters out high-frequency interference in the signal and then divides it into two. The first channel signal is output by a voltage follower (buffer), which is sampled and converted by the microcontroller's own ADC and becomes a digital quantity. The one-chip computer carries on the FFT of the signal to the less number of points, do the cycle picture analysis, get the frequency value of the signal, choose the channel of the band pass filter group. The second signal is sent to the band-pass filter bank for filtering; the result of the spectrum analysis of the single-chip microcomputer determines the output of the filtered signal. The output signal of the band-pass filter bank is divided into 2 channels. The first path is sent to the peak detection circuit; the peak detection circuit sends the peak value of the signal to the input of the single-chip ADC; the single-chip microcomputer samples and converts the peak value of the signal, and adjusts the amplification of the programmable amplifier according to the peak value to make the amplitude of the signal. The optimal range is reached; the second line is sent to the shaping circuit composed of a comparator for shaping, and the shaped signal is sent to the timer input end of the SCM, and the capture method is used to count using the multi-cycle accuracy method. Based on the counting results, the SCM displays the flow information on the LCD and sends it to the 4-20 rnA output and power management circuit through its own DAC conversion. After V/I conversion, it is converted into a 4-20 mA current signal output. The following briefly introduces some of the hardware circuits.
1.4 Bandpass Filter Bank Although the steam flow sensor signal passes through a low-pass filter, some high-frequency signals are eliminated. However, due to the wide variation in steam signal frequency, from 0.5Hz to 3.7kHz. In this band, it may include steam flow signal frequency, mechanical vibration frequency, flow field disturbance noise frequency and other noise frequencies. If this signal is directly shaped and counted, due to the effects of various noises, it is very easy to cause false triggering of the shaping circuit, which causes a large error in the measurement result.
To solve this problem, a set of analog band-pass filters are designed, including a low-pass filter and 7 band-pass filters. These 7 band-pass filters have the same circuit structure and different parameters, so that the pass bands are different from each other. However, they are interconnected to cover the band of the steam flow meter and there is a certain overlap between the adjacent passbands. One band-pass filter is implemented by one high-pass filter and one low-pass filter, which is better than the single-amplifier band-pass filter in terms of the amplitude-frequency characteristics, that is, the amplitude-frequency characteristics of the passband thus formed are relatively flat. The cut-off area decays faster. Considering that the frequency range of the entire steam signal is in the range of 0.5-3700 Hz, if a set of band-pass filter banks is used to remove the filtering, the effect is not good. Therefore, several sets of filter banks are designed for different situations, so that it has certain universality. Sexuality and interchangeability, but also to ensure a good filter effect. For example, a set of parameters of a band-pass filter bank is designed for liquid flow measurement with a diameter of 15 to 200 mm, and its operating frequency covers 1 to 500 Hz; a set of parameters for a band-pass filter is designed for gas flow measurement with a 25-150 mm aperture. Operating frequency covers 19 to 2300Hz. The output signal of which filter is specifically selected for shaping and counting is determined by the result of spectrum analysis of the steam signal by the single-chip microcomputer. That is, the single-chip microcomputer performs periodic spectrum analysis on the collected steam sensor signal to determine the range of the steam signal; accordingly, it determines which band-pass filter is used to filter and reshape the signal so that the various noises can be eliminated to the greatest extent. The effect of the signal is to avoid false triggering and to ensure the accuracy of the count.
1.5 Power Management and Current Output Modules
4 ~ 20mA output and power management module consists of 4 ~ 20mA current transmitter XTR115, DC / DC, 3 LDO and beads BEAD. The 24V DC voltage changes from 24V to 3.3V through DC/DC, and goes through LDO to 3V. As the power supply for the digital part, 3.3V is converted to 3V through another LDO, and it is used as the power supply of the analog circuit part. The connection between the digital ground and the digital ground is through magnetic beads, so that the digital part matches the level of the analog part, and the microcontroller consumes less current at a voltage of 3V. At the same time, the 24V DC voltage is changed to 7V through an LDO, and the temperature and pressure compensate part of the constant current source. The system consumes current detected by the XTR115 and adjusts the output current. Since there is no isolation between the system power supply and the input, the case (ground) and the system ground (analog ground, digital ground) are isolated to meet the insulation requirement (ie floating ground).
2 software development
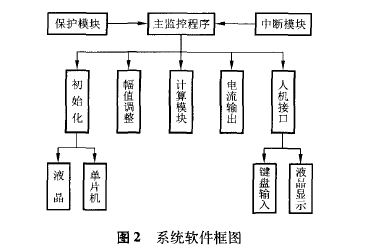
2.1 Overall Block Diagram The overall block diagram of the system software is shown in Fig. 2. It is composed of a main monitoring program module, a protection module, an interruption module, an initialization module, a programmable amplifier adjustment module, a calculation module, a current output module, and a human-machine interface module. Among them, the initialization module includes LCD initialization, initialization of fluid medium and gauge diameter, initialization of peak detection module, initialization of 4-20 mA current output module, initialization of temperature and pressure compensation module, initialization of power-off protection module, initialization of flow calculation module, and band-pass filter. Select Initialize.
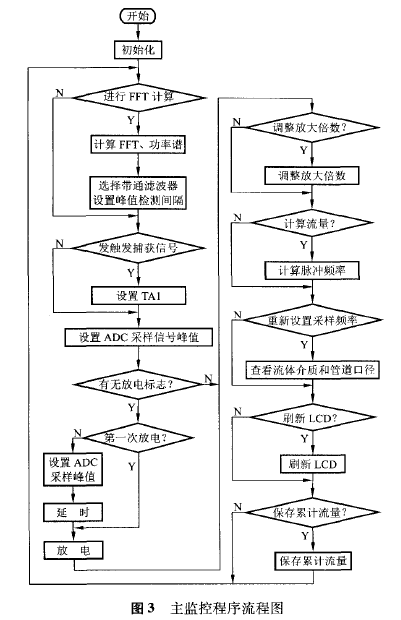
2.2 Main Monitor Program Flow Chart The main monitor program module in Figure 2 is the total scheduler for the entire software system. Subroutines in each module are called to achieve the required functionality of the system. The main monitor process is shown in Figure 3. It is a cyclic program. When the system is powered on, the main monitoring program runs automatically, and it enters into loops that constantly query the flags and perform corresponding processing.
The basic process is: immediately after the system is powered on, it is initialized; after the initialization, the Fn is first queried and the flag is set. If it is set, the FFT calculation module is called to perform the charge amplification, voltage amplification, low-pass filtering and voltage. Follow the steam sensor signal to do FFT calculation, spectrum analysis and correction, estimate the frequency of the maximum energy, select the band-pass filter according to this frequency, and set the peak detection time interval, clear the flag after the processing is completed; then, Query whether the flag that triggers the capture signal is set.
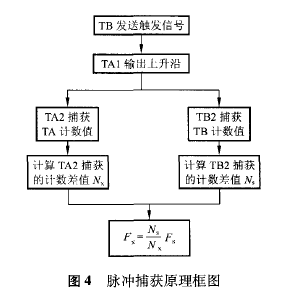
2.3 Pulse counting Pulse counting is performed using multi-cycle precision measurement methods. Set timer A (TA) to steam signal pulse counter, set timer B (TB) to fill pulse counter, and let TA's PWM module (TA1) trigger acquisition signal at regular time (the timing is determined by the lower limit of measurement frequency) TA and TB capture the number of steam signal pulses and the number of fill pulses according to the time interval between the signals captured by the adjacent two triggers. The steam is calculated based on the number of pulses captured by TA and TB and the operating clock frequency of the TB. The frequency of the signal is shown in Figure 4. Timer A's operating clock is provided externally. Each time the external pulse is incremented, the timer A counter value will be incremented by one. That is, Timer A is used to count external pulses. Timer B is used to generate the time interval, triggering the capture signal every time the timer expires. According to this captured signal, a PWM unit (TA1) of timer A generates a rising edge. The timer A's capture unit (TA2) and the timer B capture unit (TB2) take their respective counter values ​​according to this rising edge. To capture the difference between the count difference IV of the TA of the adjacent two signals and the count difference N of the TB, then: ![]()
In the formula: F is the working clock frequency of the timer B; F is the working clock frequency of the timer A, namely the frequency of the measured steam flow signal.
2.4 Frequency Estimation Sample the signal, calculate the frequency value, select the channel of the band-pass filter bank, and then set the peak sampling time interval, that is, a band-pass filter in the specific selected band-pass filter bank, set the peak sampling process Charge and discharge time. The system uses a few point FFTr to estimate the frequency of the steam signal. First, zero-average processing is performed on the sampled signal sequence to eliminate the DC component; then, the sequence is subjected to FFT operation. In order to overcome the problem that the operating speed of the SCM is not fast enough and the memory resources are limited, we have taken the following technical measures to realize the FFrI1 operation in real time on the SCM and ensure the accuracy of the algorithm:
(1) assemble FFT program using assembly language, the operation speed is fast;
(2) The data is uniformly represented by Q13 fixed-point number, that is, 16 bits are used to represent 1 data, the most significant bit (the first bit on the left) is the sign bit, and the remaining 15 bits represent the size of the data, in which the upper 2 bits ( The 2nd and 3rd digits on the left are used to represent the integer part of the data. As a protection bit in the calculation, the lowest 13 bits (13 bits on the right) represent the fractional part of the data. The sampled data is first placed on the low side. 12 bits, then shift left by 1 bit to reduce the memory footprint. (3) Use fixed-point number calculation, that is, the data used in the multiplication and addition calculation process has a fixed decimal point to improve the calculation speed; (4 ) In the FFT calculation process, the result may be increased by a factor of 3 at the most for each stage of the disc factor calculation. With the increase in the number of calculation stages, the data expressed in the Q13 format will certainly overflow. Therefore, the calculation process The data must be shifted (right shift) to prevent data from overflowing. However, in actual calculations, not every level of calculation will overflow. If the result is shifted, the result of F will be reduced. Fine Because the shifting of data becomes smaller, i.e., reducing the effective bits of the fractional part, for this purpose, it first determines whether a calculation result is greater than 1, greater than 1 when only the shift, the shift is not less than 1. The power spectrum of the signal is calculated from the FFT calculation result. According to the principle of energy dominance, the frequency of the steam flow signal is estimated based on the peak value of the maximum power spectrum. Finally, the frequency correction of the steam flow signal is performed by using the frequency correction method t2" correction. Accuracy According to the frequency of the steam flow signal, a multi-channel selection circuit is controlled by the single-chip microcomputer, a band-pass filter corresponding to the frequency of the current steam flow signal is selected, and the band-pass filter is connected to a rear shaping circuit. Charge and discharge intervals during sampling.
2.5 Bandpass filter selection The designed passband of a low-pass filter and 7 bandpass filters cover the entire steam signal frequency to be processed. At the same time, there is an overlap between the passbands of adjacent filters. Avoid frequent switching of the bandpass filter when the steam signal frequency is at the edge of the adjacent passband, ie, avoid frequent switching of the bandpass filter. When the frequency exceeds the frequency range of the previously selected band-pass filter, a filter covering this frequency is searched to select the most suitable filter. The specific selection process is: when the frequency does not exceed the upper and lower limits of the current filter passband, the current filter is still selected; when the frequency falls exactly in the cross-band of the two filter passbands, the two filters will be based on The intersection point of the passband is used to select, that is, the intersection of the amplitude-frequency characteristics of the two filters is taken as a boundary line: when the frequency is lower than the crossover point, the filter of the low-pass band is selected, which is higher than the crossover point. Select the high-pass filter.

3 Tests and experiments After the system was developed, we performed tests of system power consumption and current output accuracy, pulse count accuracy and anti-harmonic interference tests, tests for the accuracy of the calculation of the power consumption of the FFT power spectrum with a small number of points, and temperature and pressure in the laboratory. For compensation tests, water flow and air flow calibration experiments were conducted at Chongqing Naide Industry Co., Ltd. to assess the performance of the system. Due to limited space, only some of the tests and experimental results are described below.
3.1 Current output and power consumption test This system is matched with a 40 mm diameter primary meter to form a steam flow meter to perform actual flow calibration, or use a signal generator to input a standard frequency value. The Japan YOKOGAWA CAIO0 small-sized general-purpose calibrator was connected to the current output line of the system to measure the output current of the system. Note that at this point the system applies 14V (this is more stringent than the usual 24V, considering the voltage drop across the load).
First of all, set the theoretical output current equal to or greater than 4.000mA, and assess the accuracy of the current output, that is, the minimum flow corresponds to 4mA, and the maximum flow corresponds to 20mA. Test results show that the maximum relative error is less than 0.19%. Next, set to 0.000mA, which means that the module outputting the DA control current of the system will be disconnected, and the current consumption value of the assessment system itself will be 3.775mA, which is less than 4mA. Both indicators meet the requirements of the instrument.
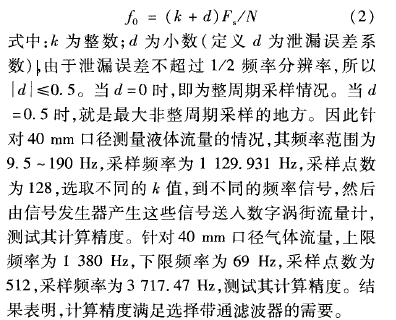
3.2 FFT Computation Accuracy Test Because the result of the FFT calculation is used to determine which band pass filter to use, the accuracy of the calculation must be evaluated. Since the maximum error of the FFT operation occurs during non-integer sampling, these maximum error points are selected for testing. Due to leakage error, the fundamental frequency of the signal is:
3.3 Actual flow test The system is matched with the 40mm diameter steam meter of Chongqing Naide Industry Co., Ltd., and the gas bell is used to calibrate and read the frequency of the system, as shown in Table 1. It can be seen that the range ratio reaches 20.6:1.
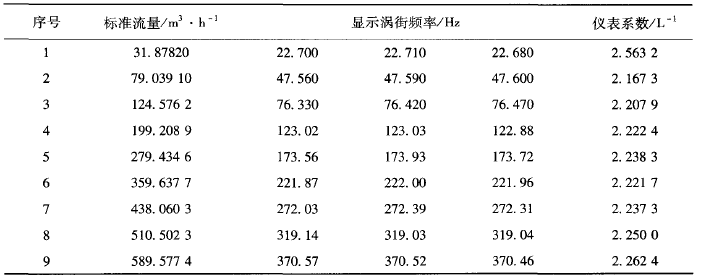
The system was matched with the 80mm caliber steam meter of Chongqing Naide Industry Co., Ltd. The gas flow calibration was performed using the standard table method, and the frequency of the system was read, as shown in Table 2. The standard table is a turbine flowmeter with an accuracy of 0.2%. It can be seen that the range ratio reaches 18.5:1.
Table 140mm digital steam flowmeter gas calibration experimental data
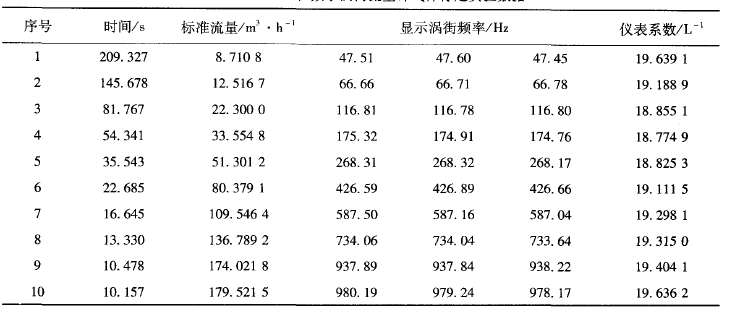
Table 280mm diameter digital steam flowmeter gas calibration experimental data
4 Conclusion Put forward the method of combination of low-point power spectrum analysis and analog band-pass filter bank, and take some effective measures in terms of hardware and software. Successfully develop a two-wire digital steam flow meter with a single-chip microcomputer to expand the range ratio and guarantee The accuracy of on-site measurement and low-power operation also overcome the current low-power operation of digital steam flowmeters based on DSP, while the low-power steam flowmeter based on MCU cannot perform digital signal processing and has poor performance.
Tfpx Series Rotary Distributor
1.TFPX series distributor are easy to operate, convenient to install and maintain.
2.The direct connect drive with cycloidal reducer is adopted, which has compact structure and stable running of the discharging tubes.
3.The discharging tubes are accurately and reliably positioned to avoid material misdistribution , A cleaning bruch is equipped internally to prevent leaked materials from pilling up .
4.After the discharging tubes are positioned, they are sealed reliably with the distribution tray .
5.It is applicable to distributing powdery and granular materials in grain, feed, oil starch industries.
Rotary Distributor,Feed Rotary Distributor,Tfpx Series Rotary Distributor,
XinxiangHexie Feed Machienry Manufacturing Co.Ltd , http://www.hxfeedmill.com